Drive Performance Summary Report
Use Search to find a template, report or dashboard by name. Search is case insensitive, supports partial entries, and will display a list of potential matches.
As you enter the name in the Search field, up to 10 potential matches are displayed. If the template, report or dashboard is shown, you can select and run it directly from the match list. You can also click All Items in the match list to go directly to the Search Results.
Hitachi Storage Viewer provides different navigation options to slice and examine your collected data. You can explore the data by using the HDS customizable report templates or by using parts of your IT infrastructure as entry points. The Inventory Navigator serves as a browser for your infrastructure by object type.
Use the Reports tab to examine the Storage Viewer catalog of templates, dashboards and reports - organized by products along with user-created, and system folders. This report is located here:
Storage Viewer for Backup > Storage Utilization Reports > Drive Performance Summary
This report also can be generated via a link in the
Drive Utilization & Performance Report.
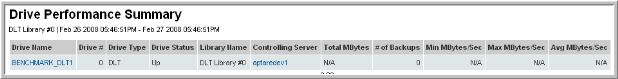
This report provides high-level drive details for the reporting period that you specified in the report scope.
Note: If you are accessing this report from the navigation pane, be sure to define a host group scope that is unique by product type—for example, only NetBackup servers. Also, this report is not supported for Veritas Backup Exec or IBM TSM data because data collection does not capture the association between backup jobs and tapes.
Drive Name | |
Drive # | Drive index. |
Drive Type | The drive type label. |
Drive Status | The current status of the drive. |
Library Name | The name of the library. |
Controlling Server | Links to the controlling server’s details in a Host Details Report. |
Total MBytes | Total MBytes used. A total for all drives is shown at the bottom of this column. |
Number of Jobs | The number of backups that used this drive. |
Min MBytes/Sec | These three values provide indicators of the drive’s performance. The Maximum rate represents the fastest speed that a job ran during the selected time frame. Likewise, the Minimum rate represents the slowest speed that a job ran during the same time frame. For NetBackup specifics, see NetBackup Drive Performance Summary. |
Max MBytes/Sec |
Avg MBytes/Sec |
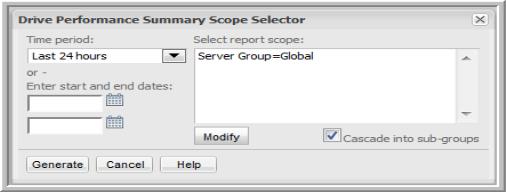
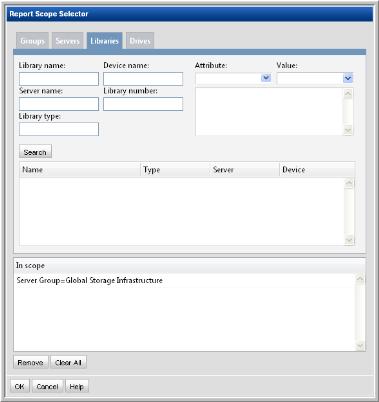
As an alternative to Host Group scope, you can select Tape Libraries as the scope:
1. In the Drive Performance Summary Scope Selector window, click Modify to change the scope.
2. In the Client Selection window, first click Clear All to remove the host groups from the “In scope” pane.
3. Click the Tape Library tab to display the list of possible tape libraries in your environment.
4. Double-click the tape libraries to include them in the scope and then click
OK.