Configure a Bar Chart Dynamic Template
Bar charts are available as two types:
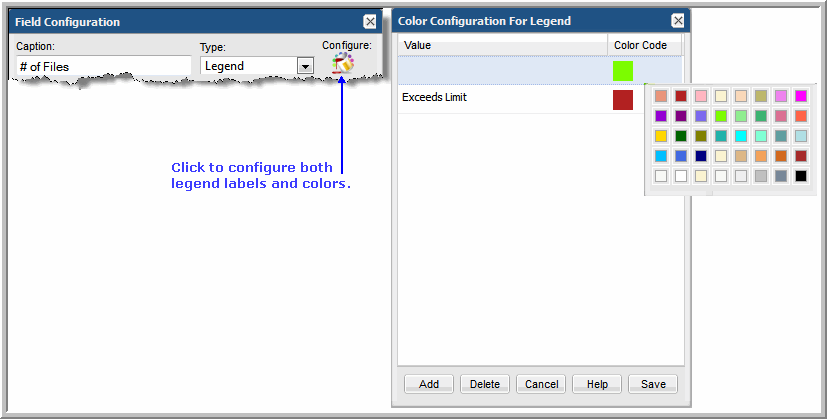
• Dynamic: With this data-driven type of chart, the system represents the data that is available and you don’t need to know how many distinct values are available. Typically, this means that you do not select colors for the bars, but let the system select them. In some cases, colors are available for selection for a limited set of known values. A dynamic bar chart requires 1 Caption, 1 Bar, and 1 Legend. In a Dynamic Bar Chart, you cannot define the tooltips for the bars.
• Static: With this type of chart, the author of the template pre-defines only the values and colors that will be represented in the chart—typically, a subset of the full set of values. A static bar chart requires 1 Caption and at least 1 Bar. Since each bar is pre-defined, you can include a percentage line in a Static Bar Chart.
Best Practices
Use the Static option if you require one of the following:
• tabular report created from a bar chart
• specific set of colors in reports
• specific captions for reports; for example, job status values of Successful, Warning, and Failed.

