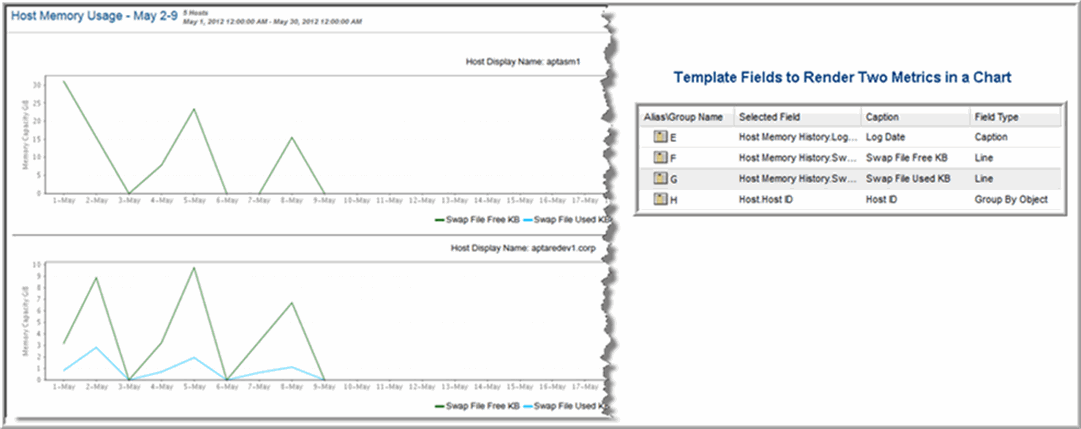
One Object Per Line Chart, One or More Metrics Per Chart
A single line chart can be used to visualize multiple metrics for a single enterprise object. For example, you might have a host with degraded performance and you want to view all the metrics for that host within a given time period. You want to examine swap file activity, free and used, over time. Each chart would have two metrics lines. At run time, the user might select 10 hosts and the resulting report would show 10 charts, one per host enterprise object.
At run time in the Scope Selector:
• Choose one or more objects to be included in the chart.
• Choose from the Group Chart By pick list: Chart Per Object.
Configure One Object Per Line Chart
Configure the following settings to create a report template for a chart that contains several metric lines per object chart. Each object in the report’s scope will have its own chart in the report.
Field Configuration for One Object Per Line Chart
• Caption Field - This required field type supplies the category caption for the x-axis. Typically, a date field becomes the caption because line chart data is best represented over a time line. When you configure a date field as a caption, the field configuration automatically sets Group By Date to Yes. See also, Format Line Chart Fields. • Line Field - A numeric field can be configured as a line. One or more line fields can be included in a line chart report template. Select Line for the field type and then select a color.
• Add Group - (Optional) Use this option to create folders when you need to group data fields that have disparate units of measure. For example, you might have a capacity value in KiB, but a performance value in Kbps. This requires two charts with different metrics scales to plot the values. In the Dynamic Template Designer, click
Add Group to create a folder for each group so that each group will have its own chart. Once you create a group, every field within the template must reside within a group, so you will likely need to create additional groups that will include the remaining fields. Note that the Group functionality is used in tabular reports to create spanning headers, but in the case of line charts, it enables separate charts. See
Add a Group to Create Separate Line Charts in a Report.
• Column Break - (Optional) Enable this setting on either an object name or object ID; for example, array name or array ID. This setting creates a chart for each object, such as each array in the report scope. For Line Chart report templates, if the template includes a field of type, Group By Object, one field must have Column Break set to Yes. Typically, a field of type, Group By Object or Hidden, is used for a Column Break. This field must have unique values, such as an Array ID. Only one field can have the Column Break set to Yes. See also
Column Break for Line Chart Report Templates.
• Group by Date - If a date field is configured as a caption, the Group by Date setting is automatically set. However, if more than one date field is included in the template, you must select which date field should have the Group by Date setting set to Yes.
Scope Selector Configuration for One Object Per Line Chart
• Group By - If the scope selector has the Time Period component checked, the Group By component must also be checked. This enables the user to select the time units at run time: Hours, Days, Weeks, Months, Quarters, or Years.
• Group Chart By - This component lets the user select: Chart Per Object or Chart Per Metric. If the line chart report template includes a field of type, Group By Object, the scope selector must have the Group Chart By selection checked.
• Time Period - Use this component to specify the time span for the generated report.
• Top/Bottom - This enables selection of the Top n or Bottom n values, based on a metric/field. If the line chart report template includes a field of type, Group By Object, the scope selector must have the Top Bottom selection checked. When Top/Bottom is selected, an additional “Based on” selector will appear in the scope selector to choose an associated metric.

