Examples of Line Chart Dynamic Templates
The best way to learn how to define a line chart report template is to learn by example.
The following list includes a sampling of the out-of-the-box reports that are shipped with the product, along with a few examples of the relevant information to help you isolate an example of the functionality that you are trying to implement.
To help you identify a field in the template that contains this functionality, the following convention is used in the list of report templates.
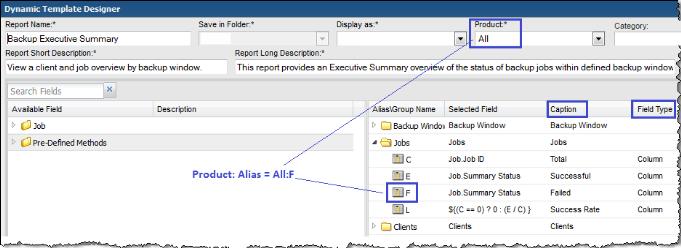
• Product:Alias combines the values listed in the template. In the following example, the selected Product is All, while the selected Alias is F.
• Some templates are vendor product-specific, in which case you may have a Product:Alias such as EMC Avamar:A
Report Template | Product: Alias | Caption | Field Type | Functions | Group |
Storage Viewer for Capacity Reports |
EMC Isilon File System Performance by Protocol | EMC Isilon: H | Max Bytes Out | Line | MAX | Yes |
| EMC Isilon: A | # Active Clients | Line | AVG | Yes |
NetApp Cluster-Mode NFS Performance by Vserver | NetApp Cluster-Mode: B | Cluster Name | Group By Field | | Yes |
| NetApp Cluster-Mode: D | Avg Write Latency | Line | AVG | Yes |
NetApp Cluster-Mode Performance by Node | NetApp Cluster-Mode: H | Log Date | Caption | | Yes |
| NetApp Cluster-Mode: N | Disk Read | Line | AVG | Yes |