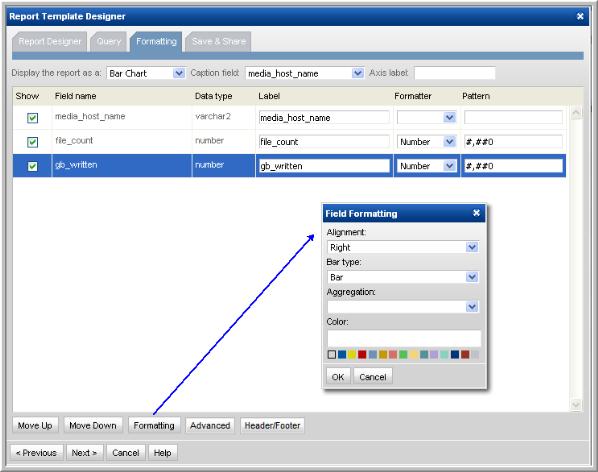
Alignment, Aggregation, Bar Type, and Bar Type Color
Select the Field and click Formatting (at the bottom of the window) to view the formatting options.
• Data alignment - Left, Center, or Right.
• Aggregation - Sum, Average, Minimum, Maximum
• Bar type - Bar or Line (for bar charts only)
• Color - Bar or Line (for bar charts only)
3. At the bottom of the Formatting window, use the Move Up and Move Down buttons to organize the fields in the order that you want them to appear in a tabular report. Be sure to select a row before shifting the fields.
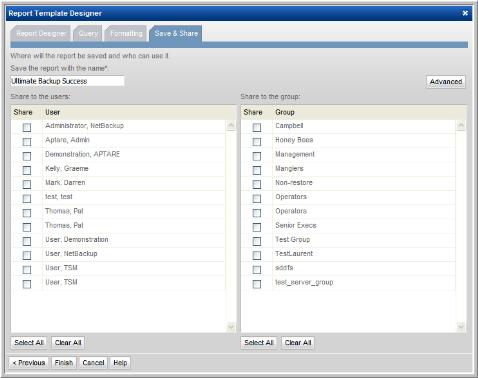
4. In the Save & Share window, complete the appropriate text boxes to save and share the report, then click OK. You can choose one or more users and user groups. The saved report template will be listed in the report group that you select.
Configuring a Header and Footer in a Custom Report Template
At the bottom of the Formatting window in the SQL Template Designer, click the Header/Footer button to launch the window where you can define the text and variables that will be displayed when the report is generated.
Any variables used in the query can be included in a header or footer, as shown in the above example.