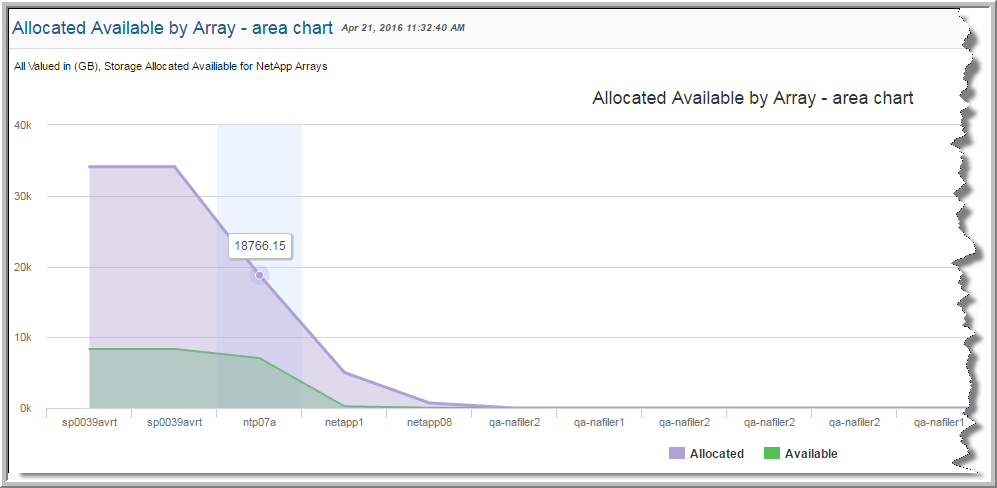
Example of Area Chart SQL Template: Allocated Available
1. From the
Template Designer tab, click
Query custom combo box.
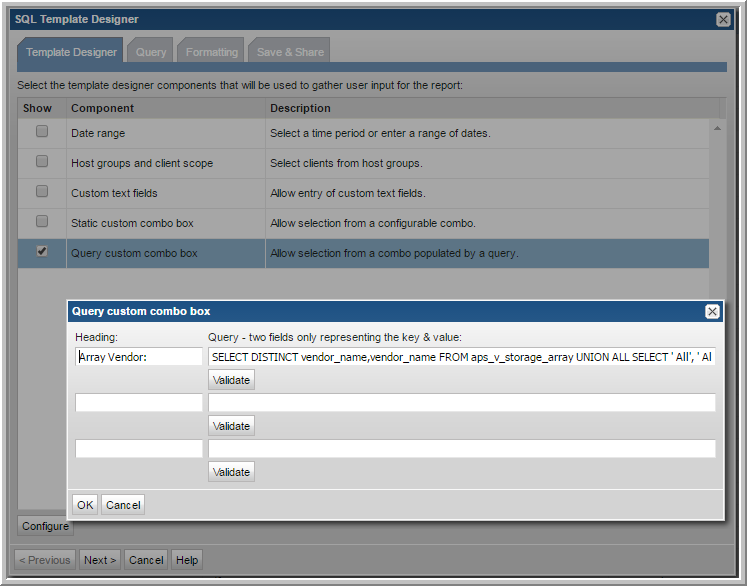
2. With the Query custom combo box selected, click Configure.
3. In the Heading field, enter the heading that will display in the report template’s scope selector drop-down list. For example Array Vendor.
4. In the Query field, enter the SQL query that returns a list of values that will be available in the combo box:
SELECT DISTINCT vendor_name,vendor_name FROM aps_v_storage_array UNION ALL SELECT ' All', ' All' FROM dual ORDER BY 1
5. Click Validate and OK.
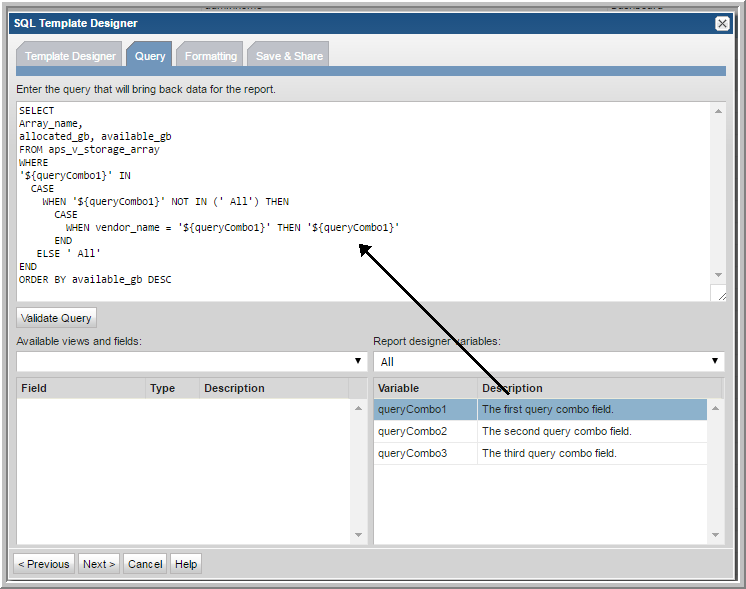
6. Click the Query tab and enter the following. This query will use the value selected in the populated combo box to retrieve the data to be rendered in the report:
SELECT
Array_name,
allocated_gb, available_gb
FROM aps_v_storage_array
WHERE
'${queryCombo1}' IN
CASE
WHEN '${queryCombo1}' NOT IN (' All') THEN
CASE
WHEN vendor_name = '${queryCombo1}' THEN '${queryCombo1}'
END
ELSE ' All'
END
ORDER BY available_gb DESC
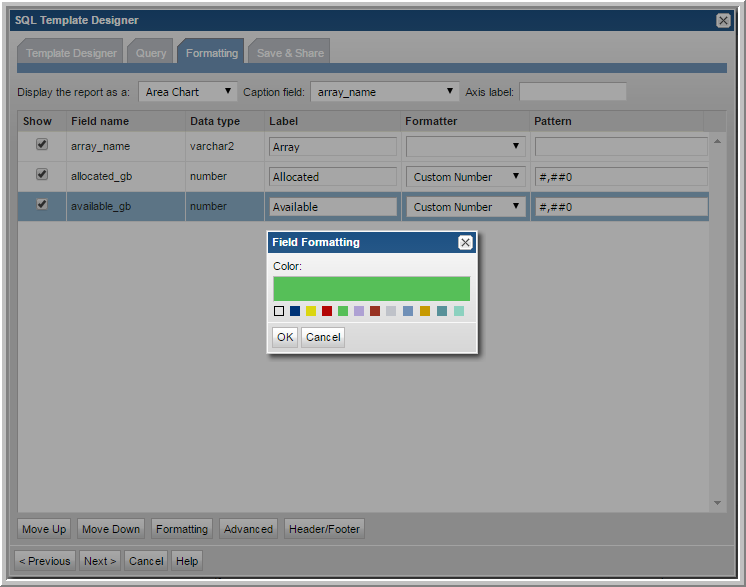
7. Click the Formatting tab.
8. In the Formatting window, select Area Chart or Stacked Area Chart from the Display the report as a drop-down list.
9. For the Caption field, select array_name from the drop-down list.
10. Select all the fields to be displayed.
11. Assign a color to each field that will be displayed as an area. In the example, assign a color to the fields
allocated_gb and
available_gb.
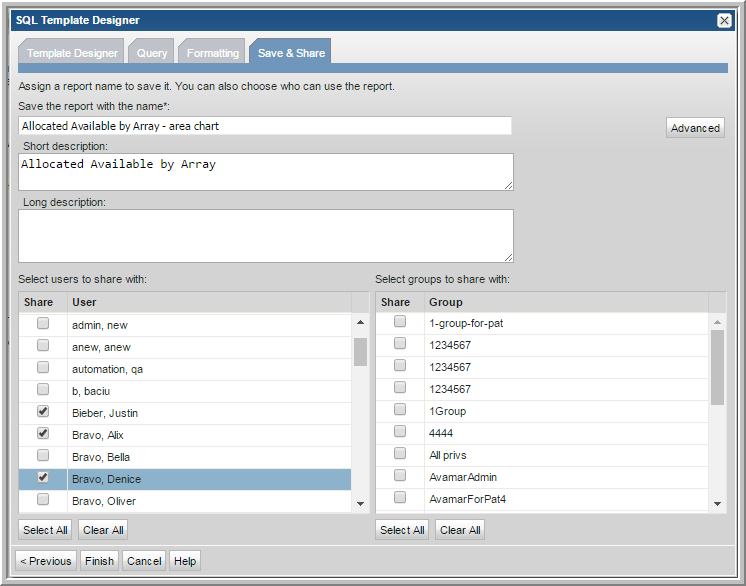
12. Assign a name for the report template and save it to a report menu group. You can also assign sharing if required.
13. Generate a report from the new template. The output will look similar to the following example: