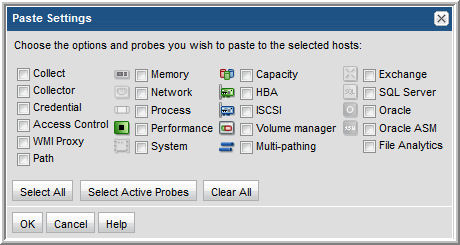

Probe Type | Parameters | Description |
• Capacity • HBA • iSCSI • Volume Manager • Multi-pathing | Probe schedule* | A schedule in cron format; for example: */20 9-18 * * * which translates to “every 20 minutes between the hours of 9 a.m. and 6 p.m.” |
Memory | Probe schedule* | A schedule in cron format; for example: */20 9-18 * * * which translates to “every 20 minutes between the hours of 9 a.m. and 6 p.m.” |
Network | Probe schedule* | A schedule in cron format; for example: */20 9-18 * * * which translates to “every 20 minutes between the hours of 9 a.m. and 6 p.m.” |
Process | Probe schedule* | A schedule in cron format; for example: */20 9-18 * * * which translates to “every 20 minutes between the hours of 9 a.m. and 6 p.m.” |
Performance | Probe schedule* | For Windows, only CPU performance will be collected. For Linux, both CPU and device performance will be collected. Note: The sysstat utility must be installed on the Linux servers or storage nodes for Linux host performance data collection. A schedule in cron format; for example: */20 9-18 * * * which translates to “every 20 minutes between the hours of 9 a.m. and 6 p.m.” |
System | Probe schedule* | A schedule in cron format; for example: */20 9-18 * * * which translates to “every 20 minutes between the hours of 9 a.m. and 6 p.m.”. |
Exchange | Collect | Check this box to activate collection on an on-going basis. When it is unchecked, only initial validation will attempt this probe. |
Probe schedule | A schedule in cron format; for example: */20 9-18 * * * which translates to “every 20 minutes between the hours of 9 a.m. and 6 p.m.” | |
Active Directory Host | Host name or address | |
Active Directory Port | For example: 389 | |
Active Directory Base DN* | The starting point for the Active Directory. For example: CN=Services,CN=Configuration, DC=contoso2003,DC=com Several tools are available to help you identify the Base DN: Ldp.exe - http://support.microsoft.com/kb/224543 | |
Active Directory User Name | Active Directory User Name This username must have privileges to search under the base DN within the Active Directory. Typically, this is an Administrator. | |
Password | Active Directory Password | |
SQL Server | Collect | Check this box to activate collection on an on-going basis. When it is unchecked, only initial validation will attempt this probe. |
Probe schedule | A schedule in cron format; for example: */20 9-18 * * * which translates to “every 20 minutes between the hours of 9 a.m. and 6 p.m.” | |
Database* | The name of the database within the SQL server. | |
Instance | The system identifier to identify the SQL server database instance—for example: BKUPEXEC. Specify either an instance name or a port. If an instance name is not specified, MSSQLSERVER is substituted. | |
Port | To identify the SQL server instance, provide either an instance name or a database port number; for example: 1433. If a port number is not specified, the port is determined automatically from the instance name. | |
Account* | Database access user name The data collector requires a user account with permissions to execute the stored procedures | |
Password* | Database access password | |
Windows Authentication | Check this box if you want Windows authentication rather than SQL server authentication. | |
Oracle | Collect | Check this box to activate collection on an on-going basis. When it is unchecked, only initial validation will attempt this probe. |
Probe schedule | A schedule in cron format; for example: */20 9-18 * * * which translates to “every 20 minutes between the hours of 9 a.m. and 6 p.m.” | |
SID* | The system identifier to identify the database instance. | |
Port* | Database port number; default: 1521 | |
Username* | The Oracle user must have the following role granted: SELECT_CATALOG_ROLE To grant this access, use: GRANT SELECT_CATALOG_ROLE TO ‘user’ where user is the database Username that you’ll provide here. | |
Password* | Database access password | |
Oracle ASM | Collect | Check this box to activate collection on an on-going basis. When it is unchecked, only initial validation will attempt this probe. |
Probe schedule | A schedule in cron format; for example: */20 9-18 * * * which translates to “every 20 minutes between the hours of 9 a.m. and 6 p.m.” | |
Account* | The Oracle user privileges required: SYSDBA privilege if 10g sysasm in 11g | |
Password* | Database access password | |
Port* | Database port number; default: 1521 | |
ASM Instance* | The name that identifies the database instance. | |
Storage Viewer for File Analytics | Collect | Check this box to activate collection on an on-going basis. When it is unchecked, only initial validation will attempt this probe. |
Probe schedule | Default is once a month. A schedule in cron format; for example: */20 9-18 * * * which translates to “every 20 minutes between the hours of 9 a.m. and 6 p.m.” | |