Organizing Reports > Understanding Dashboard Icons
  
Version 10.0.01
Understanding Dashboard Icons
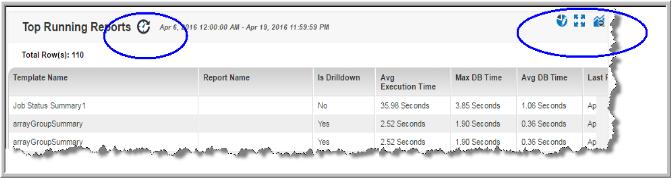
Once placed on a dashboard, you can revise the scope or remove the report entirely. These functions are displayed when you hover your cursor over the report title. The placement varies depending on the report type, but icons are displayed in the top right corner of your report portlet. You can change a report location by simply dragging it to a new position. See also Interacting with Reports.
 
Data Age Indicator - When a report is served from the cache, an indicator icon is displayed on reports and dashboards. You can roll over the indicator to show the age of the report from the cache. Click the icon to rerun the report from the database. See About Cached Reports on Dashboards for more information.
Edit Scope - Allows you edit the scope of the individual report portlet and rerun the report without impacting the entire dashboard. See Editing the Scope for a Report on a Dashboard for details.
Remove Report from Dashboard - As you use your dashboards, you may find that some reports are no longer relevant. These reports can be quickly removed from your dashboard. See Removing Reports from Dashboards.
Expand - Charts displayed as components of a dashboard may be hard to read. Click the Expand icon to pop the chart out of the dashboard and have it displayed in the full browser window. See Expanding a Report to Full Size on a Dashboard.