Monitor Data Collector Status
You can monitor data collection from a single window. This functionality is very useful if your environment contains more than one backup solution or collectors for multiple enterprise objects.
1. Select Admin > Data Collection > Status.
2. Click Expand All.
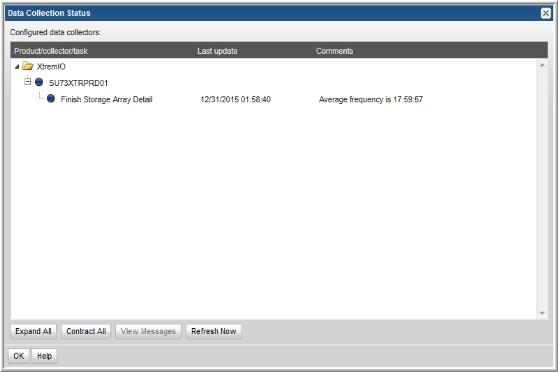
The last update and status from the individual collectors are aggregated up to the Data Collector level. Collectors can be shown or hidden using the +/- icon.
Colored indicators illustrate four possible states:
* Blue - The task is operating within correct thresholds.
* Amber - The task is operating outside of the usual thresholds, but is still operational.
* Red - The task has failed.
* White - There is no data for the task.
The parent collector will display a red status if:
• Data has not been collected in the expected time interval.
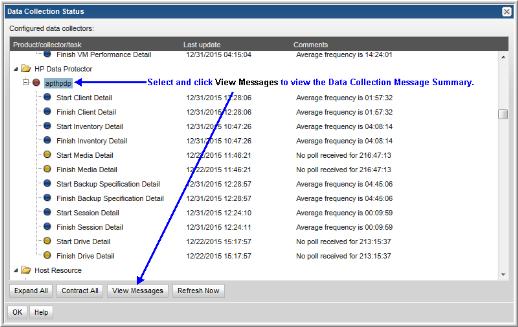
3. Check for exceptions in the Data Collector log files by selecting a collector in the Data Collection Status window and clicking View Messages.
Note: Currently, messages are available only for EMC Avamar, EMC NetWorker, HP Data Protector, and Storage Viewer for Capacity Host Resources. Therefore, the View Messages button will not be accessible for other types of messages.