Getting Started with the Inventory Navigator
The view into your Inventory can be customized by grouping the inventory objects by a variety of attributes such as type, location or business unit to further visualize the data in a way that is the most relevant to you. Further, the information is presented in two view options, a list view and a reports view — offering you the ability to review your data in a way that makes the most business sense.
The following figure highlights key terms and functional areas in the Inventory Navigator.
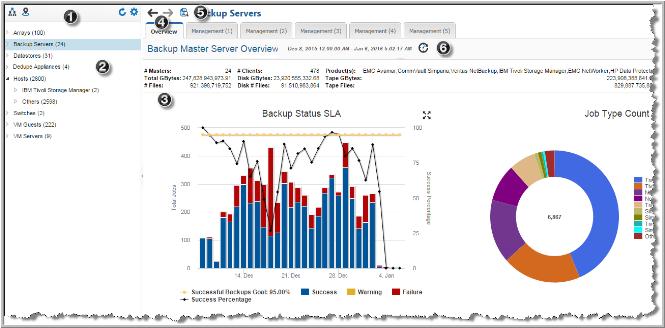
1. Hierarchy Toolbar - Use the toolbar to organize the display of your inventory. Select from three options:
a Object type and subsystem (default hierarchy)
b Location and object type
2. Hierarchy Panel - Navigate through the inventory by expanding and collapsing categories. Select a category or an individual object to display relevant reports. If an attribute is used to group objects, this is easily identified in the panel. See
Using Attributes to Organize your Data.
4. Navigation Buttons - Navigate within a single session, to jump back and forward through your Inventory history. This is useful when trying to complete a root cause analysis and you need to jump between multiple objects/pages within the Inventory.
Note: Changing the hierarchy or logging out clears the Inventory history.
5. Toggle to Inventory List or Inventory Reports - Allows you to toggle between the Inventory List and the Inventory Reports for categories of objects. The previous graphic is displaying the Inventory Reports. The Inventory List displays all the collected inventory objects for a category and enables management functions.
6. Data Age Indicator - When a report is served from the cache, an indicator icon is displayed on reports and dashboards. You can roll over the indicator to show the age of the report from the cache. Click the icon to purge the old report from the cache and rerun the report from the database.
When you run a report, Hitachi Storage Viewer takes the scope of the report, and checks if the cache contains the same report, for the same scope. If it does, the results are displayed from the cache. If the combination does
not exist, the report is run from the database, saved in the cache, and then sent to the user interface. Cached reports are shared across users who belong to the same home host group. See also
How Reports and Caching Work Together.