Line Charts for Performance Metrics
Line charts provide a meaningful visualization of performance over time. Use line charts to represent performance data, such as array performance metrics.
Array performance data is collected from certain storage arrays:
• NetApp ONTAP Cluster-Mode arrays
• Isilon arrays
• Array LUN performance statistics are collected for Dell Compellent, EMC VNX (CLARiiON), EMC Symmetrix, HDS Tuning Manager, HP 3PAR, IBM SVC, IBM XIV, NetApp ONTAP (Block only), and NetApp Cluster-Mode.
For collected array LUN performance data, default retention periods (raw, hourly, and daily) control the retention of the data, as shown in the following list. At each data collection cycle, Hitachi Storage Viewer determines which data needs to be aggregated and moved to the next period. When the daily performance data ages out, it gets deleted. These defaults represent contiguous interval periods.
• Raw - Kept for 72 hours (3 days)
• Hourly - From the 4th day for an interval of 21 days
• Daily - From the 24th day for an interval of 180 days (6 months)
Identify Array Performance Data Fields for a Template
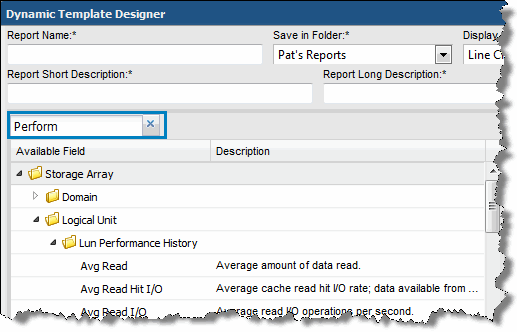
Use the Search feature in the Dynamic Template Designer to find performance statistics in the database fields.
Historical performance metrics are collected for the following enterprise objects:
• Host - Chargeback, CPU, Memory, and Network history is available. Search on History in the Dynamic Template.
• Job - The backup/restore job itself has historical information associated with it. Each job record is the history.
• Storage Array - Search on Log in the Dynamic Template. Search on History in the Dynamic Template.
Rules and Guidelines for Performance Line Charts
Several rules govern the creation of a line chart for performance metrics, as listed in the following table.
Rule for Performance Metrics Line Charts | Description/Example |
1. If aggregation is defined for a line, all lines must have an aggregation specified. | |
2. The Group By scope selector component is required only if the lines have aggregation functions applied. | |
3. If no aggregation has been specified for lines, the raw data will be returned in the report. | Array performance data is captured and stored as raw, hourly, and daily records. When raw data is used, the dates reflect exactly when the data was captured, including the seconds. |
4. A date field should be defined as the caption. | This provides the x-axis time period markers. Note that time-series charts automatically calculate the x-axis labels based on the data. Therefore, your Group By selection in the scope selector may not always render with the set of dates that you expect for the time period. |
5. The Time Period scope selector is always required for performance line charts. | Performance metrics are best represented as time-series charts. |
6. Use the Add Group option to create folders when you need to group data fields that have disparate units of measure. | For example, you might have a capacity value in KiB, but a performance value in Kbps. This requires two charts with different metrics scales to plot the values. |

