Steps to Create a Line Chart Dynamic Template
To create a line chart report template, start with the following steps.
1. Select Tools > Dynamic Template Designer.
2. Choose an Enterprise Object (Data Domain, Host, Job, or Storage Array) and click OK.
3. In the Dynamic Template Designer, select a folder to save the template into and
the display type. Be sure to select Line Chart, as it enables options specific to this feature.
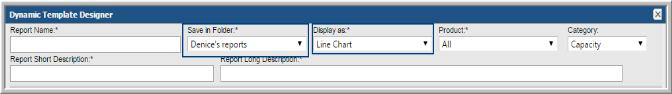
4. Enter a report name, short description, and long description.
5. Optionally, assign a category.
6. Drag fields into the report scope and reference the following sections to determine how fields should be configured.
7. At the bottom of the Dynamic Template Designer, click Configure Charts to define the label and metric unit to be displayed in the y-axis.